Shreya Purohit Data Analyst
Work
This page highlights my work in data analytics, including hands-on projects and professional experience:
Portfolio / Experience / Education / Other Projects
Portfolio Projects
These are selected hands-on projects where I worked with real-world data to build dashboards, perform analysis, and write end-to-end case studies:
Iowa Liquor Procurement & Vendor Performance
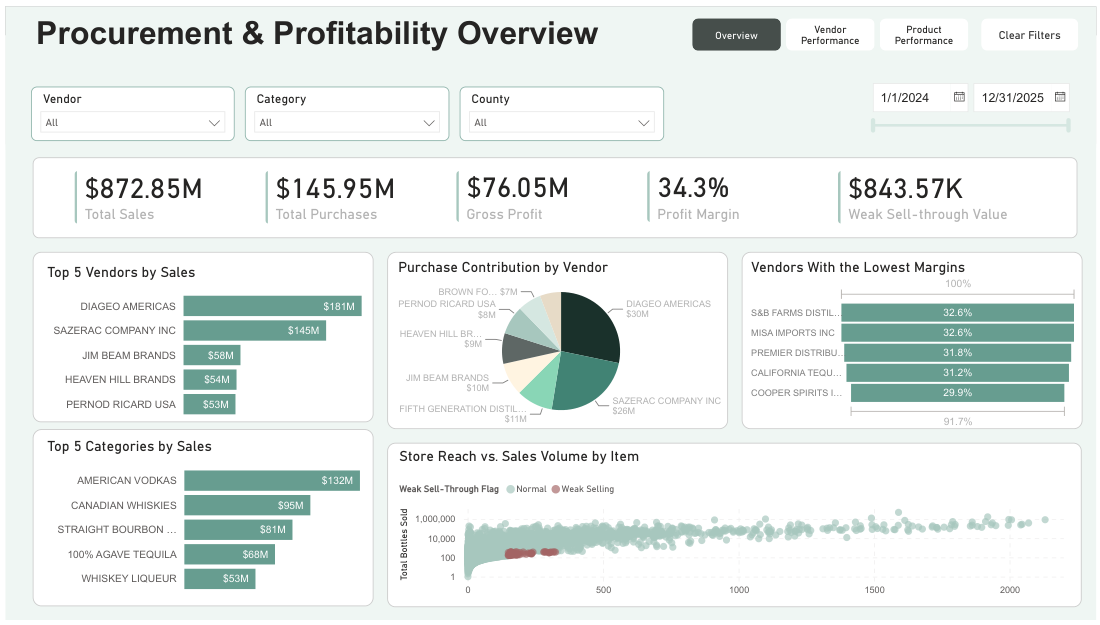
Modeled 5.6M liquor transactions into a star schema, performed EDA and hypothesis testing to examine profit margins across vendor tiers. Used SQL & Python for data analysis, and Power BI to visualize procurement performance and profitability.
Hospital Operations & Financial Analysis
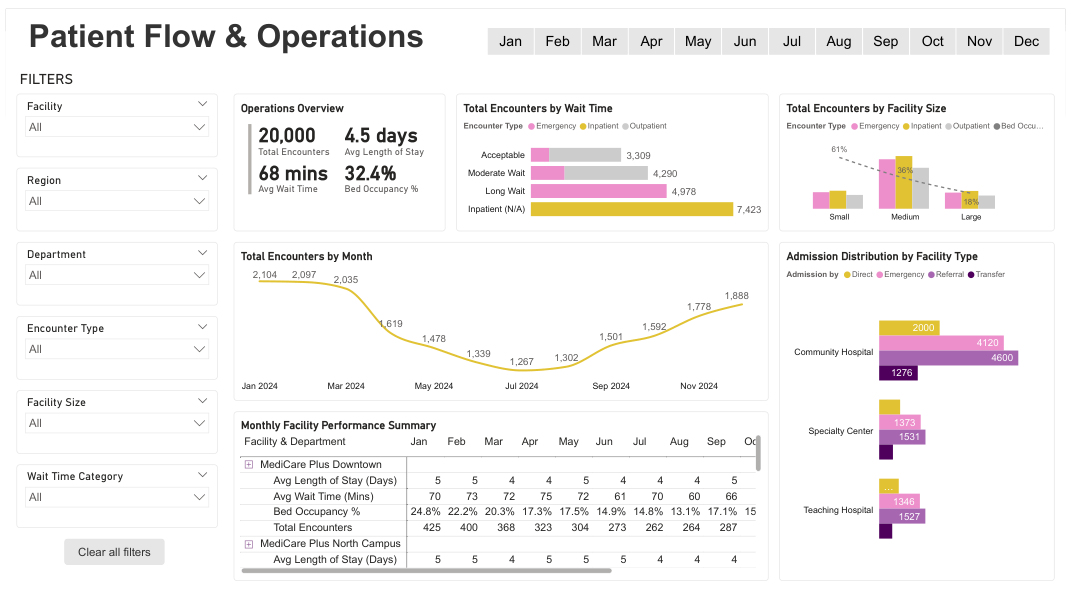
Built an end-to-end healthcare analytics solution across five hospitals. Modeled and transformed data using Python, SQL, and DuckDB, then built a three-page Power BI dashboard to analyze patient flow and operations.
Bank Marketing Campaign Analysis
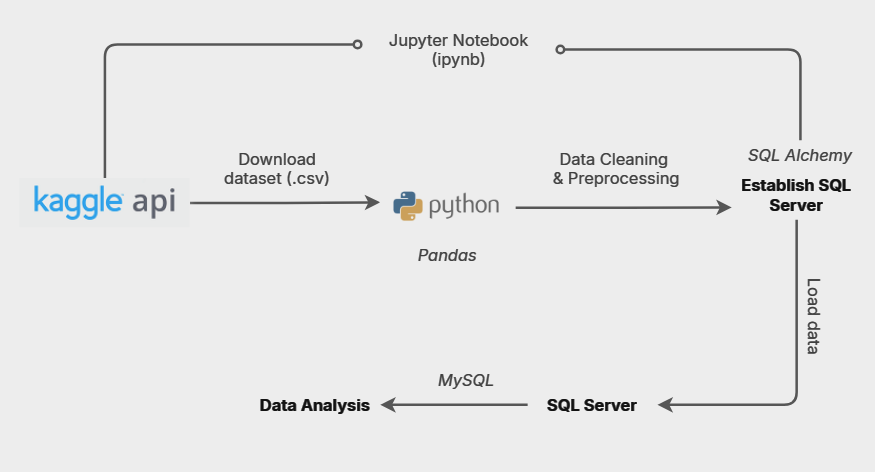
In-depth SQL analysis of a bank’s marketing campaigns to identify customer segments and factors influencing campaign outcomes.
Global Population Trends: EDA
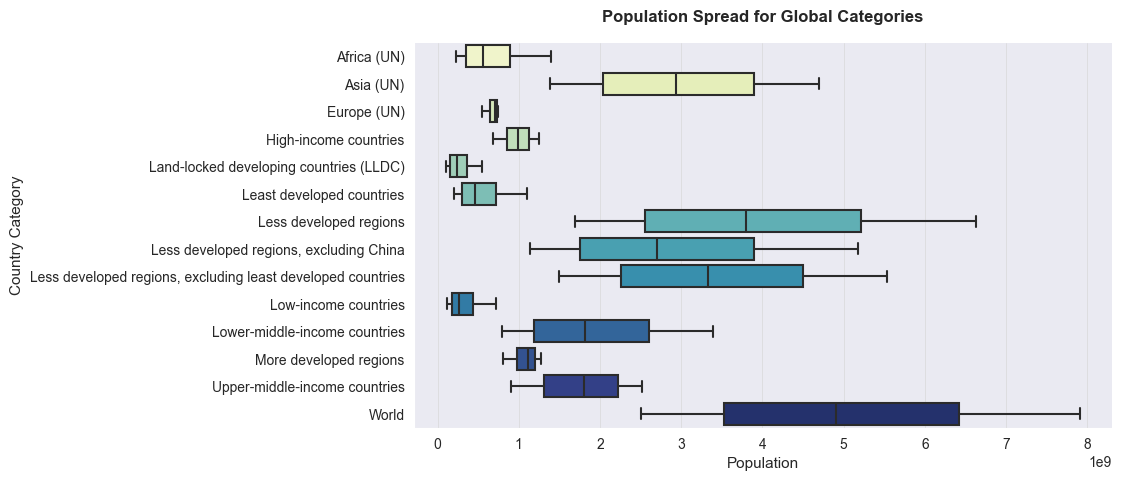
Explored global population data (1950–2021) using Python to analyze growth patterns and demographic shifts. Used Python for EDA and statistical analysis.
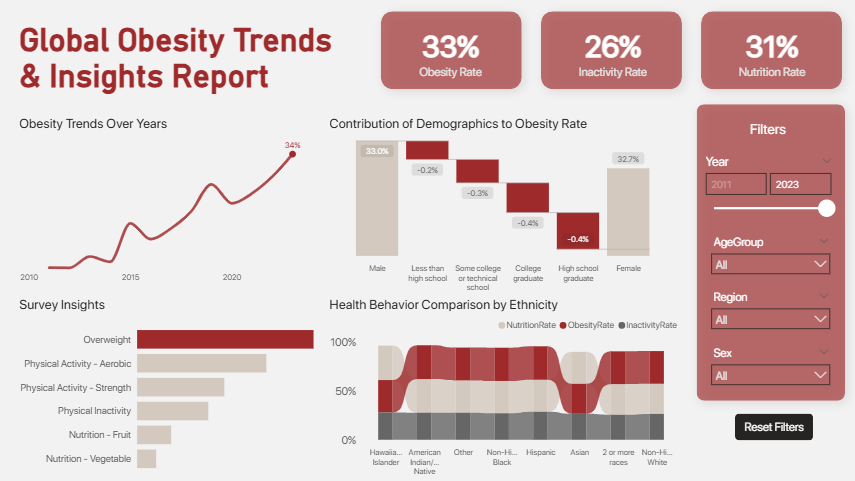
Obesity Trends & Patterns Dashboard
Analyzed global obesity trends from 2011 to 2023 alongside physical activity and nutrition data to highlight key risk factors. Built a Power BI dashboard to identify world-wide patterns.
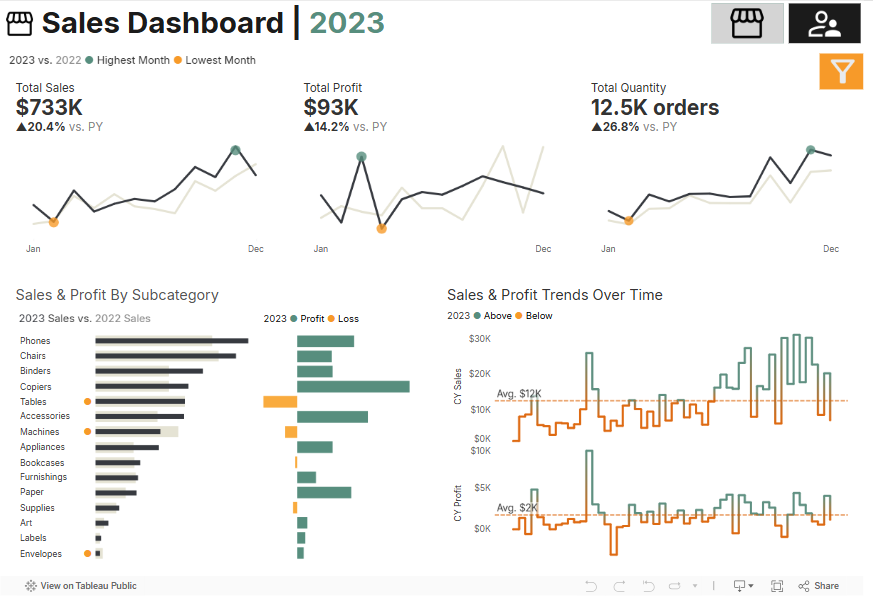
Sales Performance Dashboard
Built an interactive Tableau dashboard to analyze sales performance, track key sales metrics and support business decision-making.
Professional Experience
Freelance Data Analyst
I work independently on data analytics projects for clients through direct outreach and freelance platforms. I also collaborate with developers to write technical articles on data science and related topics. More on my blog.
Skills: Data Analytics, Client Delivery, Technical Writing
Technical Writer - Talent500 / LambdaTest / TutorialsPoint
With a focus on data analytics and developer tools, I've worked with leading tech platforms to research & simplify complex topics into accessible content for data professionals. I ensure all content aligns with the brand's tone and strategy to drive user engagement.
Skills: Data Analytics, Content Strategy, Research
Junior Machine Learning Engineer Intern - Omdena
Worked on a global impact project to detect bias in climate news reporting where I collected, cleaned, and prepared survey data for model training. Here I collaborated with a remote team, which helped me learn how to distribute tasks & manage project workflows effectively.
Skills: Web Scraping, Data Analysis, Technical Documentation
Education
Bachelor's in Biotechnology
GBPIET, Uttarakhand Technical University
Thesis: Molecular Dynamics Simulation using GROMACS (View thesis →)
- Conducted molecular dynamics simulations using GROMACS for drug design as part of my undergraduate thesis. Worked with AutoDock & PyMOL.
- Gained experience in research methodology, data analysis, and computational tools.
Other Projects
A personal project to explore how data can support public health, humanitarian aid, and social impact to support awareness through open visualizations and insights.
[TBD] A self-initiated project to build a simple, visual knowledge base of commonly used KPIs in to make data literacy accessible to anyone.
e-mail / linkedin / github / X